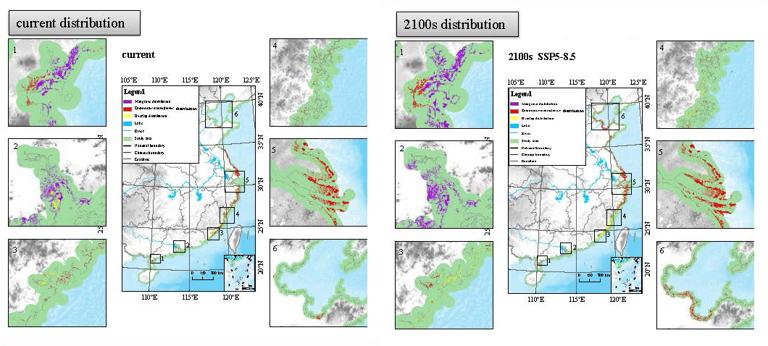

Our simulation results have been listed in the folder, and the data description is as follows: 1. Format: GeoTIFF 2. Projection: Albers 3. Spatial range: China 4. Spatial resolution: 250m 5. Explanation:
(1)mangrove_distribution_current.tif,mangrove_distribution_future_2100ssp126.tif,mangrove_distribution_future_2100ssp370.tif,andmangrove_distribution_future_2100ssp5 85.tif represent the distribution of mangrove forests in the current period (1981-2010) and under three climate scenarios (SSP1-2.6, SSP3-7.0, and SSP5-8.5) in the future period (2071-2100). The values are 0 and 1, with 1 indicating the existence of a distribution and 0 indicating the absence of a distribution.
(2)mangrove_richness_current.tif,mangrove_richness_future_2100ssp126.tif,mangrove_richness_future_2100ssp370.tif, and mangrove_richness_future_2100ssp585.tif represent the richness of 15 domain mangrove species in the current period (1981-2010) and under three climate scenarios (SSP1-2.6, SSP3-7.0, and SSP5-8.5) in the future pe r i od (2071-2100). The values are integers (1, 2, 3, …, 12), representing the sp e c ies richness within each grid unit.
(3)Spartina_alterniflora_distribution_current.tif,Spartina_alterniflora_distribution_fu ture_ssp126.tif,Spartina_alterniflora_distribution_future_ssp370.tif,andSpartina_alterniflora_distribution_future_ssp585.tif represent the distribution of Spartina_alterniflora in the current period (1981-2010) and under three climate scenarios (SSP1-2.6, SSP3-7.0, and SSP5-8.5) in the future period (2071-2100). These data values are 0 and 1, with 1 indicating the existence of a distribution and 0 indicating the absence of a distribution.